Welcome to Chartography.net — insights and delights from the world of data storytelling. In this issue are things from three people I pay close attention to.
But first, some timely log-rolling.
🍎 Letterform Archive asked me to lecture on letterforms in data graphics. I’m bringing lots of goodies, today! Tuesday October 29th. Tune-in live, free: https://letterformarchive.org/shop/compared-to-what/
🎙️ I spoke with Wired founding editor Kevin Kelly about my favorite tools to better enjoy books. Listen to our COOL TOOLS episode wherever you podcast, or watch our discussion on YouTube: https://kk.org/cooltools/rj-andrews-data-storyteller/
🎨 The vector artwork is nearly done for the first MAPS FOR KIDS poster, a classic diagram of an “American” 4-4-0 steam locomotive. I’ve remixed the best of two centuries worth of visual explainers into this one and the result is really exciting.
Soon, I will move on to styling this artwork by choosing colors, fill textures, and adding some subtle distress to all. Then, I need to repeat this process for the second and third posters. Can I do it? I don’t know yet! Follow along with the creative nitty gritty of this emerging endeavor with a paid subscription to Chartography.
📚 My new book, Info We Trust, is on its way to our European and American distribution centers. Behind all that shrink wrap and cardboard sits beautifully-printed data graphics:
We have an interesting publication timing update for you.
The official release of Info We Trust Remastered has been pushed to March 2025. But—would I make everyone wait until March to get theirs if we have books in hand? Never.
Kickstarter backers and pre-orders placed soon will receive the book as soon as possible. We are calling these pre-publication books limited early editions. Place your order now to get in before the window for these early editions closes.
Inspiration
In the last week or so, three people I pay attention to published new expressions of their vocational projects.
Over the years, each of these people have steered me through my own fascination with data graphics. In all of my personal interactions I’ve found each not only generous with their enthusiasm, but also very kind.
It is easy for Internet things to slide on by. Don’t miss these three.
What long COVID taught me about life (and data)
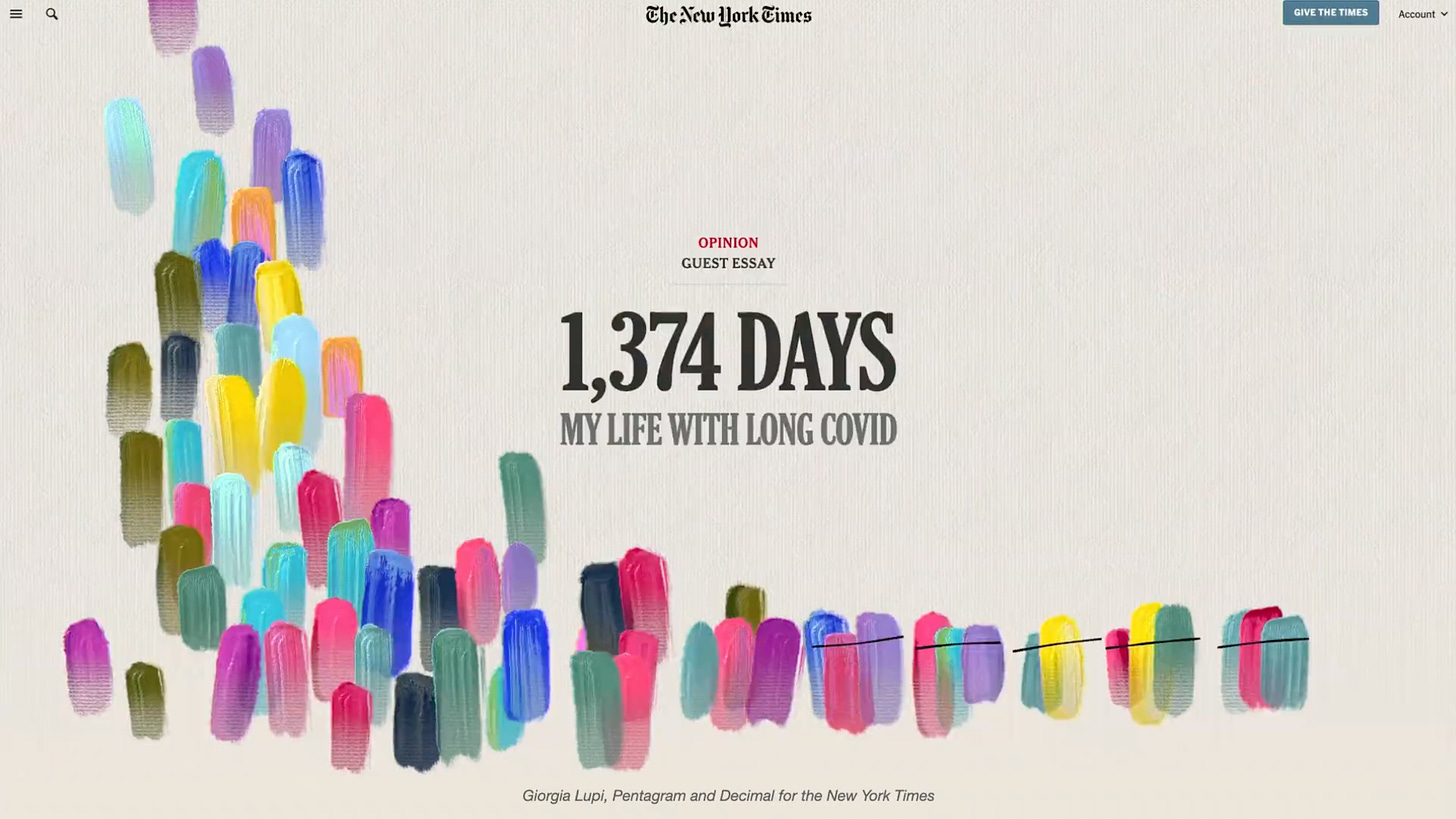
Giorgia Lupi, data-humanism advocate extraordinaire and partner at Pentagram, has a new TED talk. It reveals her process and processing of a four-year quantified-self journey with long COVID.
If we look at them and represent them for what they are, which are human and nuanced representations of our lives, data can move us profoundly. Data can shape human narratives that can open conversations, convey empathy, and even connect people.
You may be familiar with the saga from Lupi’s NYT opinion piece.
I appreciated seeing Lupi’s symptom-tracking spreadsheets, which seemed to scroll forever. I can’t fathom her lonely suffering.
I also can’t comprehend her dedicated journaling. I’ve tried daily recording aspects of my life and admit defeat, resigning that I do not have whatever it takes to do this: discipline? personality? dire need?
Near the end of the talk, Lupi recounts how she turned away from her symptom tracking after her health improved a bit. Her words are a fitting reminder that attention is king.
The world is made of data. But not the data that we produce with our smartphones or credit cards. It's made of the data that we decide to give our attention to at any given time. Because what you choose to see shapes who you will become and ultimately your entire world.
The Golden Age of Visualization Dissensus
, prolific author and Miami University’s Knight Chair in Visual Journalism, recently gave the IEEE Visualization Conference keynote.Cairo’s hour peppered me with takes that inspired new understanding, some rebuttals, and lots of curiosity. In a phrase, it got my blood boiling. Here are some hot responses from my viewing:
Consensus or dissensus? Personally, I’m going to keep teaching with “basic practice”—not best practice.
Edward Tufte’s worst ideas are being kept alive on life support by critics.
The important book that needs a fresh critique and reconsideration is Wilkinson’s Grammar of Graphics.
Statistics is statecraft. Data is history. Both can be a horror show.
Cairo’s talk introduces a vision of a Nietzchean hammer walloping the field of data visualization. I have a vague fear that he, and others, might be taking the field and especially the study of its history for granted. From my small perspective, data graphics is under threat from a variety of new pressures and we should be strategic in how we step forward.
In contrast to logical “Apollonian” data visualization Cairo introduces the concept of Dionysian data graphics. I want to see that talk from him next.
The Speed of The Earth
Map collector extraordinaire David Rumsey and Kevin Kelly (mentioned above) went to Burning Man with a mile-long art installation.
a roughly one mile long line of 30 strobe lights mapping the rotational speed of the earth on its axis - 1156 feet per second or 788 miles per hour
Here’s a short drone video of the map in action, moving at the Earth’s rotational speed at the latitude of Black Rock City:
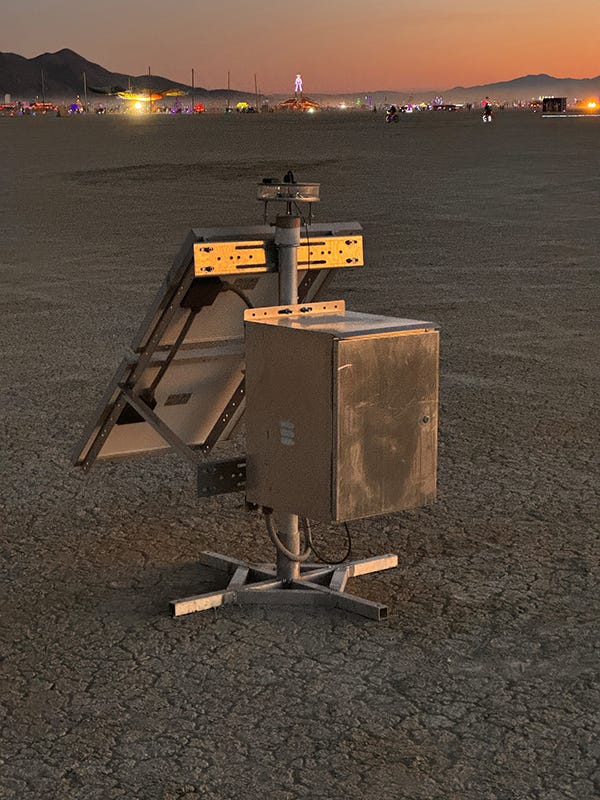
Each strobe unit operated around the clock on its own solar power:
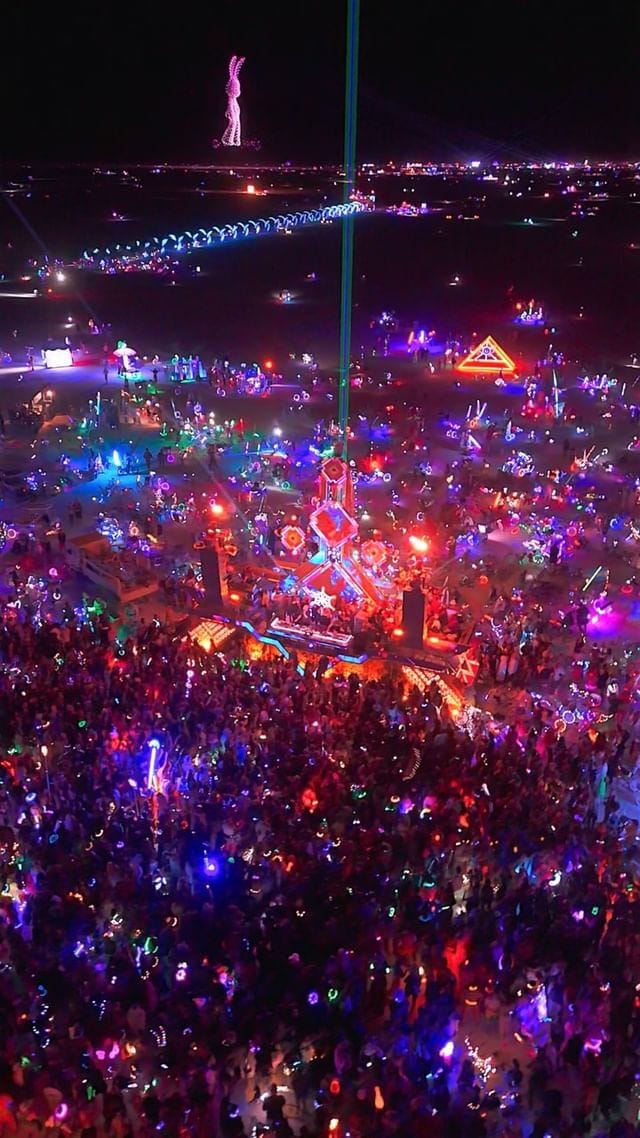
The work stood out among the illuminated chaotic joy of the playa:
Seeing Rumsey make at such a grand scale (and especially in ways that connects back to his PULSA origins) inspires me to do more. Learn more about the installation in the David Rumsey Map Collection newsletter.
Onward!—RJ
About
RJ Andrews helps organizations solve high-stakes problems by using visual metaphors and information graphics: charts, diagrams, and maps. His passion is studying the history of information graphics to discover design insights. See more at infoWeTrust.com.
RJ’s next book, Info We Trust, is currently available for pre-order. He published Information Graphic Visionaries, a book series celebrating three spectacular data visualization creators in 2022 with new writing, complete visual catalogs, and discoveries never seen by the public.


