

Inspiration from Info We Trust #034

Tasty election viz + Stanford exhibition recap + Announcements!
This week's inspiration: Election Carto Cake
In 2018, Bloomberg Graphics (Twitter) visualized results of the United States midterm election live with red and blue icing on a pre-printed cartogram cake. Titled the Great American Vote-Off, it may be the most joyful piece of election viz ever.

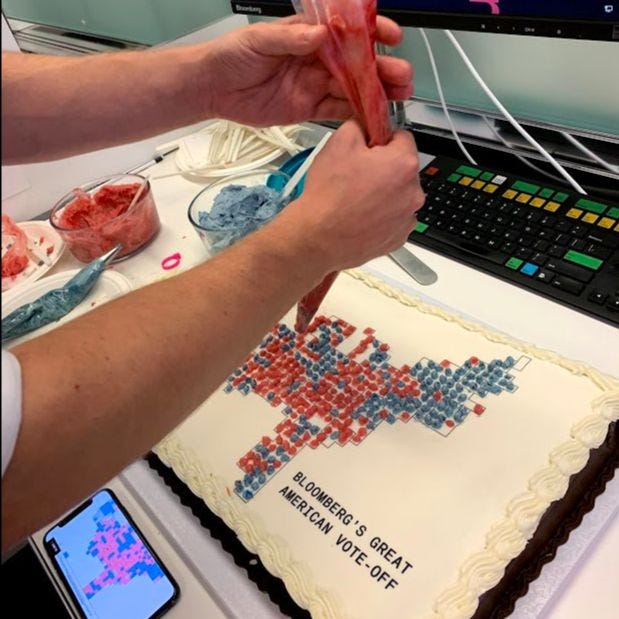
Will the carto cake return this week? I hope so, but also understand why the pandemic might have killed this too. See the hashtag #bbgcartocake for more progress shots from 2018. The map was completed and cut at 5am the next morning - delicious!

The launch of Data Visualization and the Modern Imagination for Stanford University was a big blast. The digital exhibit is now open at https://exhibits.stanford.edu/dataviz.
My opening talk is below. In the prepared segment I discuss three stories about visionary pioneers before giving a general tour of the exhibit.
My favorite part of the event was the interactive Q&A that followed my prepared remarks. Hundreds of people stayed for almost two hours and we covered a lot of ground. Jump to this part of the video directly 42 minutes in.
The Rumsey Map Center also collected dozens of links and resources mentioned during the Q&A, see them all here.
🔅COMING SOON🔅
📺 Deep dive chat about my craft with Andy Kirk for his video/podcast show Explore Explain.
👨🚀 Release of a new print about Apollo 11 moonwalk in time for the holidays.
🎨 A brand new interactive data story built with love to give you a little escape, and hopefully a little joy.
Until then,
Onward! -RJ
Like inspiration? See more at Info We Trust: