Information Graphic inspiration from Info We Trust #043
Information Graphic Inspiration #043
the most curious pie charts + peek at book-making
This week's inspiration: Today One Way, Tomorrow the Other
Paris engraver Nicolas Guérard (1648?-1719) created the below piece of social commentary nearly one hundred years before William Playfair's credited 1801 invention of the pie chart.
It contrast the typical days of Parisian women and men with 24-hour clocks, supported by a divided rider. Guérard's perspective is summarized at the bottom: Paradise for women, Purgatory for men, Hell for horses.
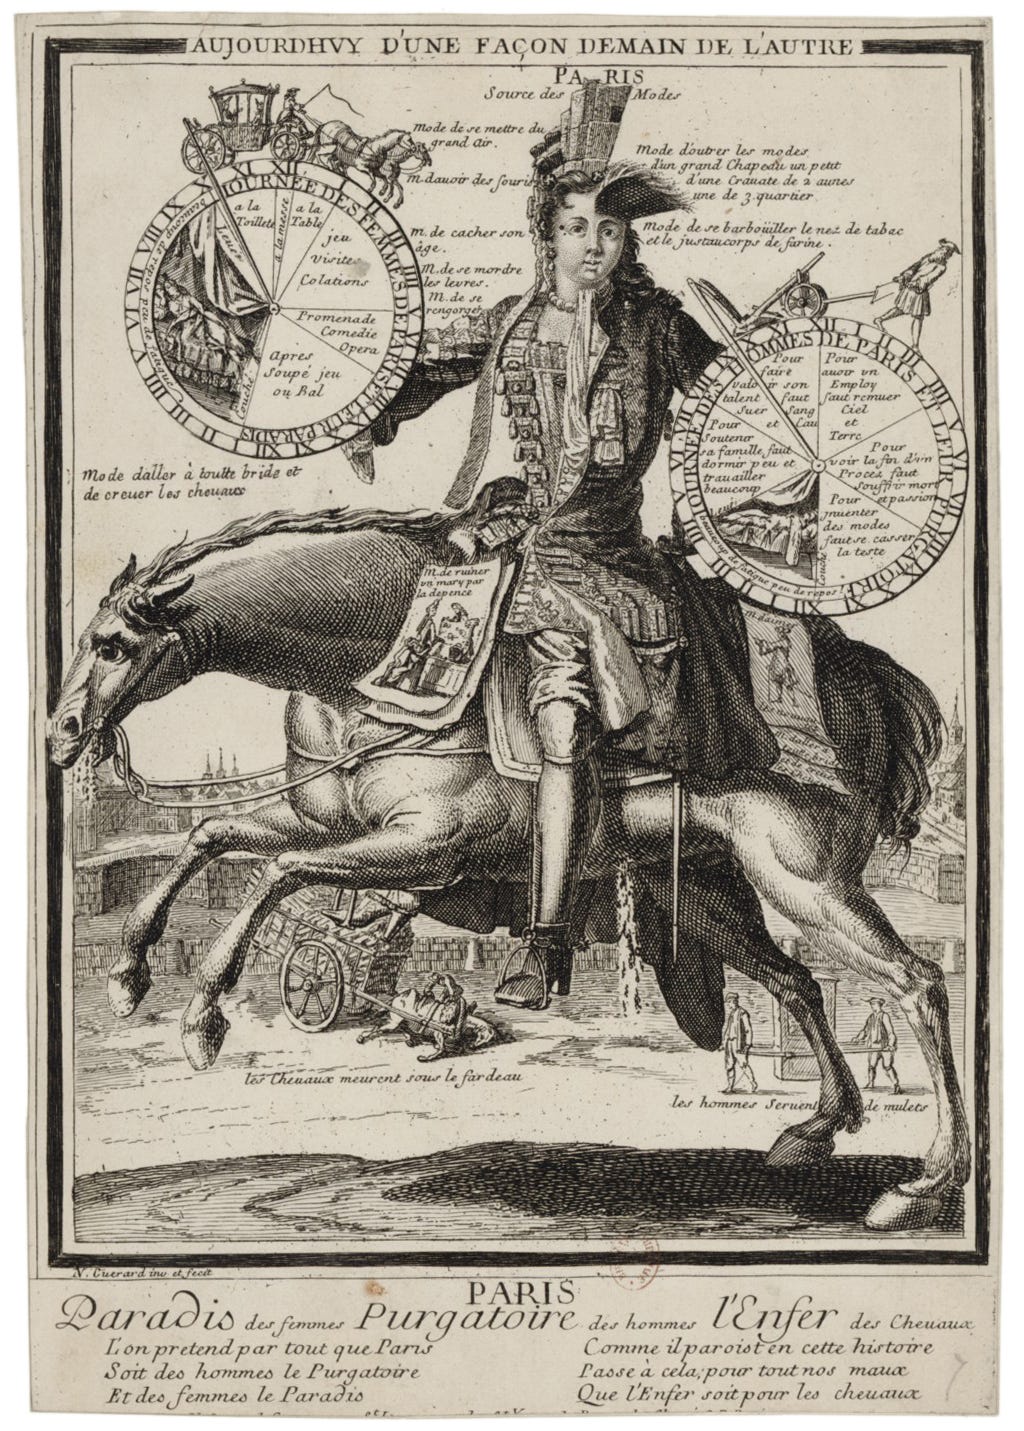
Each clock summarizes a typical day's activities by sizing segments of the pie, or, in France: the 🧀camembert.
According to Guérard, women sleep longer than men. This category is emphasized with illustrated segments.
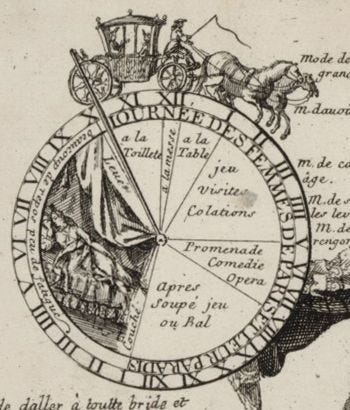
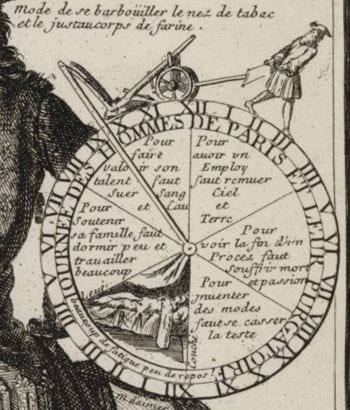
Woman's relative fortune is also emphasized by the armature that moves the clocks through their cycles: a horse-drawn coach for woman, a plough for men.
Antoine de Falguerolles, Université de Toulouse III retired senior lecturer in applied statistics, translated the categories from French for us:
The typical woman's day is divided in 7 unequal slices. Clockwise from bottom (1AM):
illustration of long resting time (1 to 10) preceded by coucher (bedding) and followed by lever (rising)
dressing
Church
lunch
game, visit, collation
Promenade, Comedy, Opera
after dinner, game or dance
The typical man's day is divided in 6 equal slices. Clockwise, starting from bottom (midnight):
illustration of small resting time (12 to 4) preceded by coucher and followed by lever
to support one's family, sleep little and work a lot
to affirm one's talent, sweat blood and water
to get a job, move heaven and earth
to see the end of a trial, suffer death and passion
to invent fashions, rack your brain
Below the rider is the poor horse, whose doom is alluded to behind the rider's contrasting shoes. In the background, a horse has collapsed dead from pulling a cart. Its deadly toil is juxtaposed to the burden of male valets.

The rest of the image, from Bibliothèque nationale de France's Gallica, is just as dramatic and packed with detail.
Michael Friendly (Twitter) brought this illustration to my attention in the course of our writing a new paper tracing the origins and precursors of Florence Nightingale's polar diagrams.
"The Radiant Diagrams of Florence Nightingale" will shortly appear in the online journal SORT, 45(1). You can read a free preprint here:
Guérard's sectored circles remind me of my first public splash with charts, Creative Routines (2014). It also employed 24-hr clocks to chart typical days (but with midnight at top).

Seeing the 300-year old antecedent makes me want to revisit this piece with a more illustrative flair.
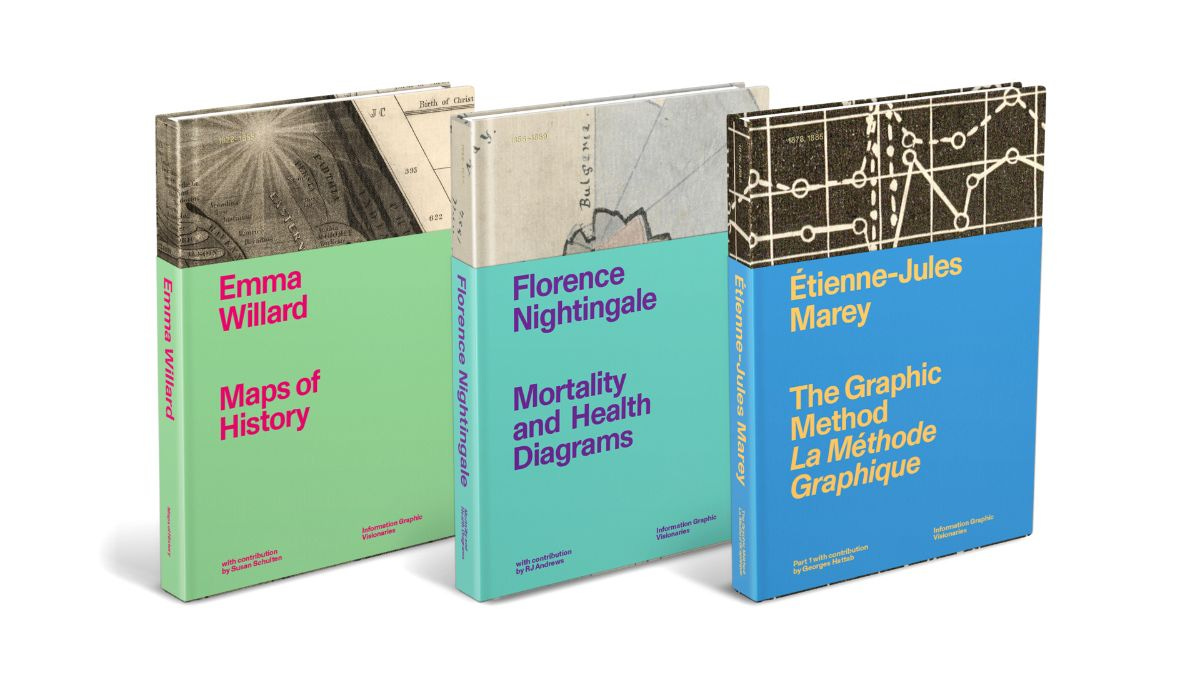
Information Graphic Visionaries
As we enter the last full week of our crowdfunding campaign to create Information Graphic Visionaries, I am excited to already return to book-making.
Our story describes that each book features two components:
New writing to help you understand the Visionaries.
Actual size reproductions that display the richness of their craft.
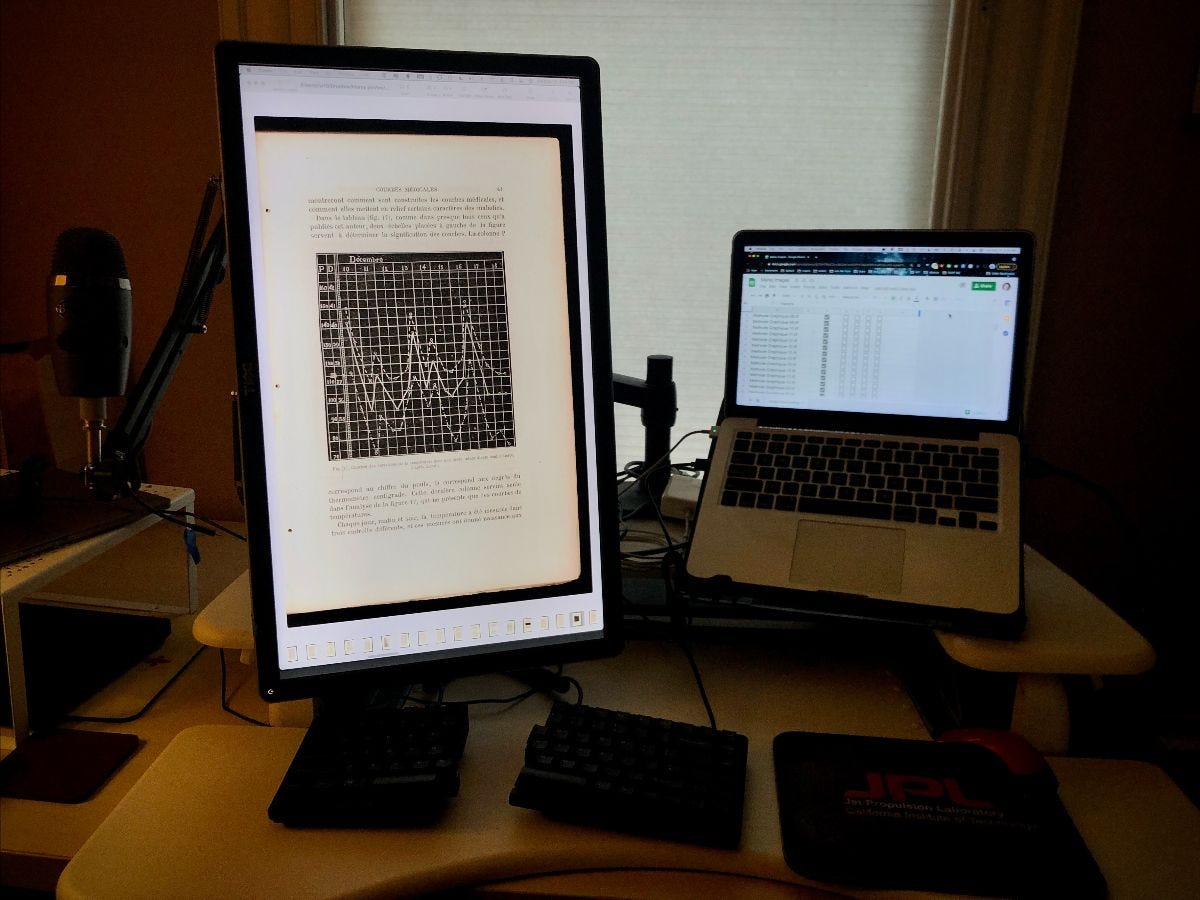
I have returned to work on both components of the Étienne-Jules Marey volume: reviewing notes on our translation, commenting on Marta Braun's introductory essay, and proofing high-res photography of an original 1885 edition of the work. You can read all about this effort in our most recent campaign update blogpost.
Our campaign now boasts over 500 backers. Wow!
We are making these books. The campaign, and its special Kickstarter pricing, ends in about one week.
I am grateful for your support and emboldened by your enthusiasm.
Onward! -RJ
Like inspiration? See more at Info We Trust:


