Welcome to Chartography.net — insights and delights from the world of data storytelling.
Housekeeping: I’ve temporarily paused paid subscriptions to Chartography while I focus on promoting my new book. Monthly subscribers won’t be charged during this pause and this time will not count against annual subscribers’ year.
⭐️ Info We Trust is now on Amazon and already has 72 reviews! Let’s see if we can get it over 100. Once you’ve enjoyed the book, please consider adding your five-star review on Amazon to help it reach more readers. Each positive review is a lasting contribution to the book’s life. Thank you for sharing your enthusiasm.
Of course, you can also purchase the book directly from Visionary Press. We have only ten copies left in Europe, so please grab one of those quick if you are in the EU and appreciate fast and cheap shipping.
I’m excited to celebrate Info We Trust with so many of you soon:
🌲 April 4th Rumsey Map Center afternoon public event at Stanford.
🥂 April 17th New York City evening event with Ellen Lupton at Cooper Union with following reception in gallery. ⚠️ We already have over 400 RSVPs for this event. Message me directly if you need to get off the waitlist.
🖼️ April 16 & 17 public exhibition at 41 Cooper Gallery NYC. More on this below.
📚 May 5 evening talk at The Book Club of California in San Francisco.
The Craft of Data Graphics
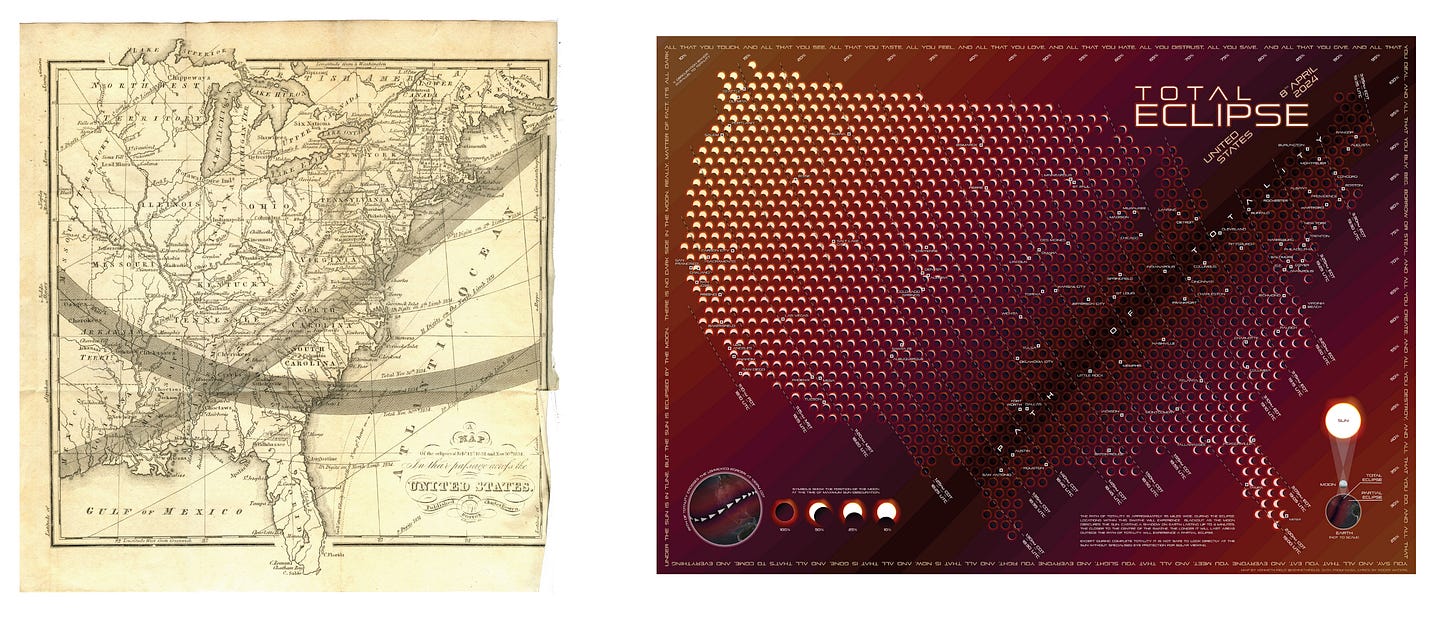
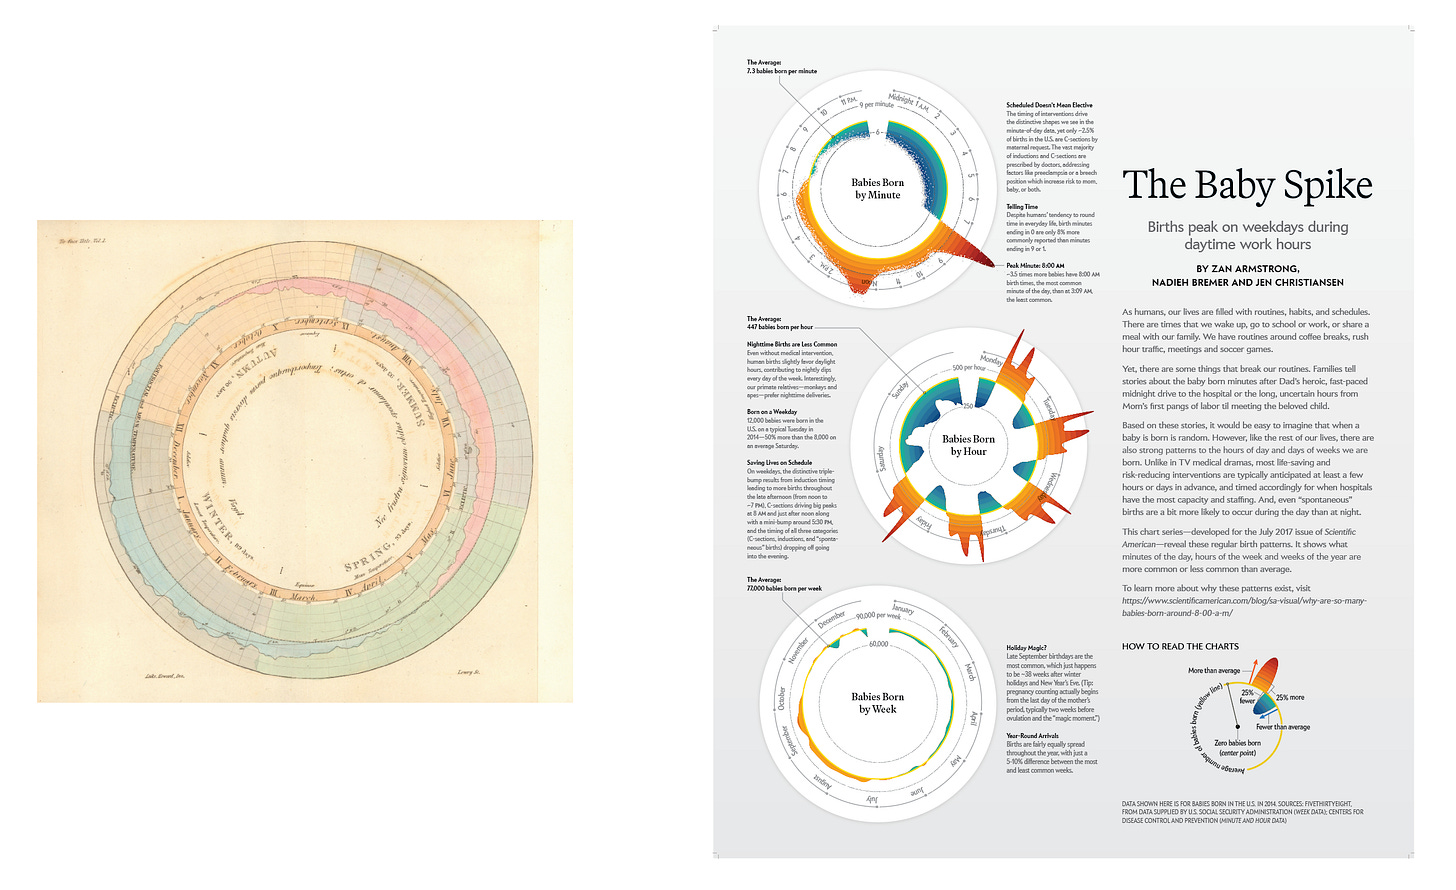
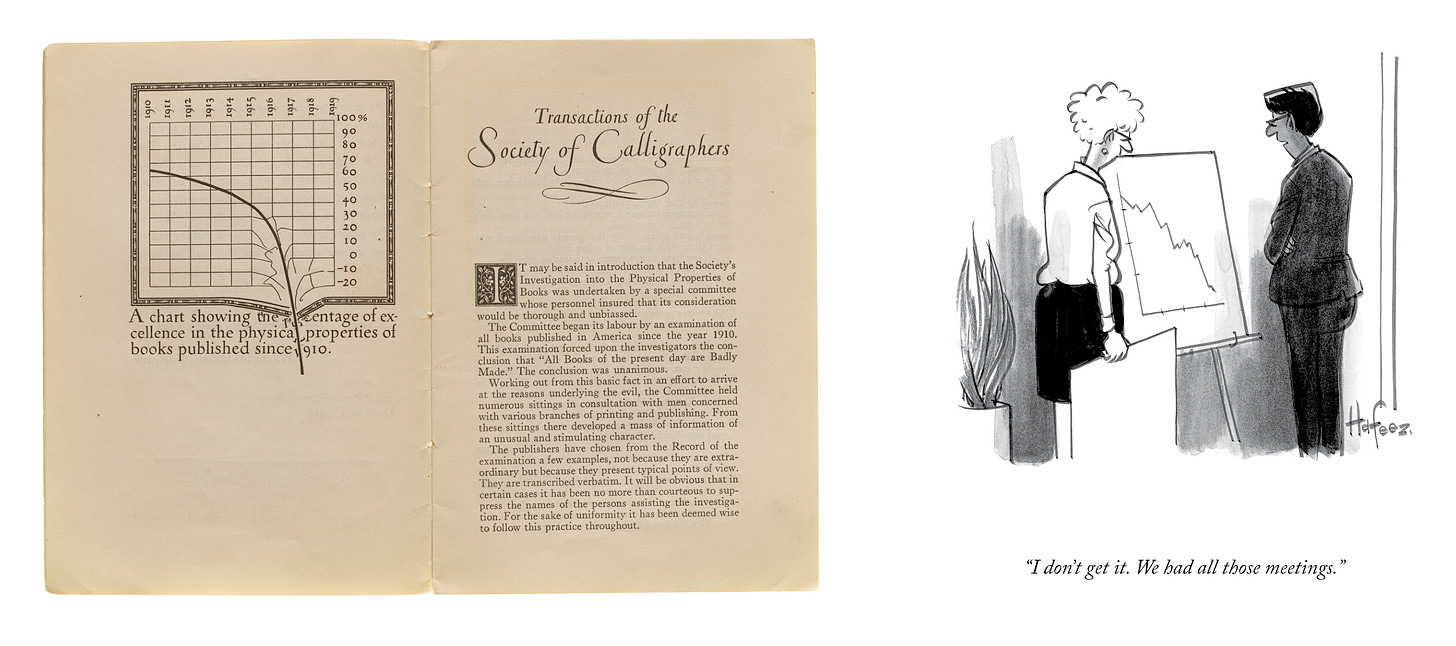
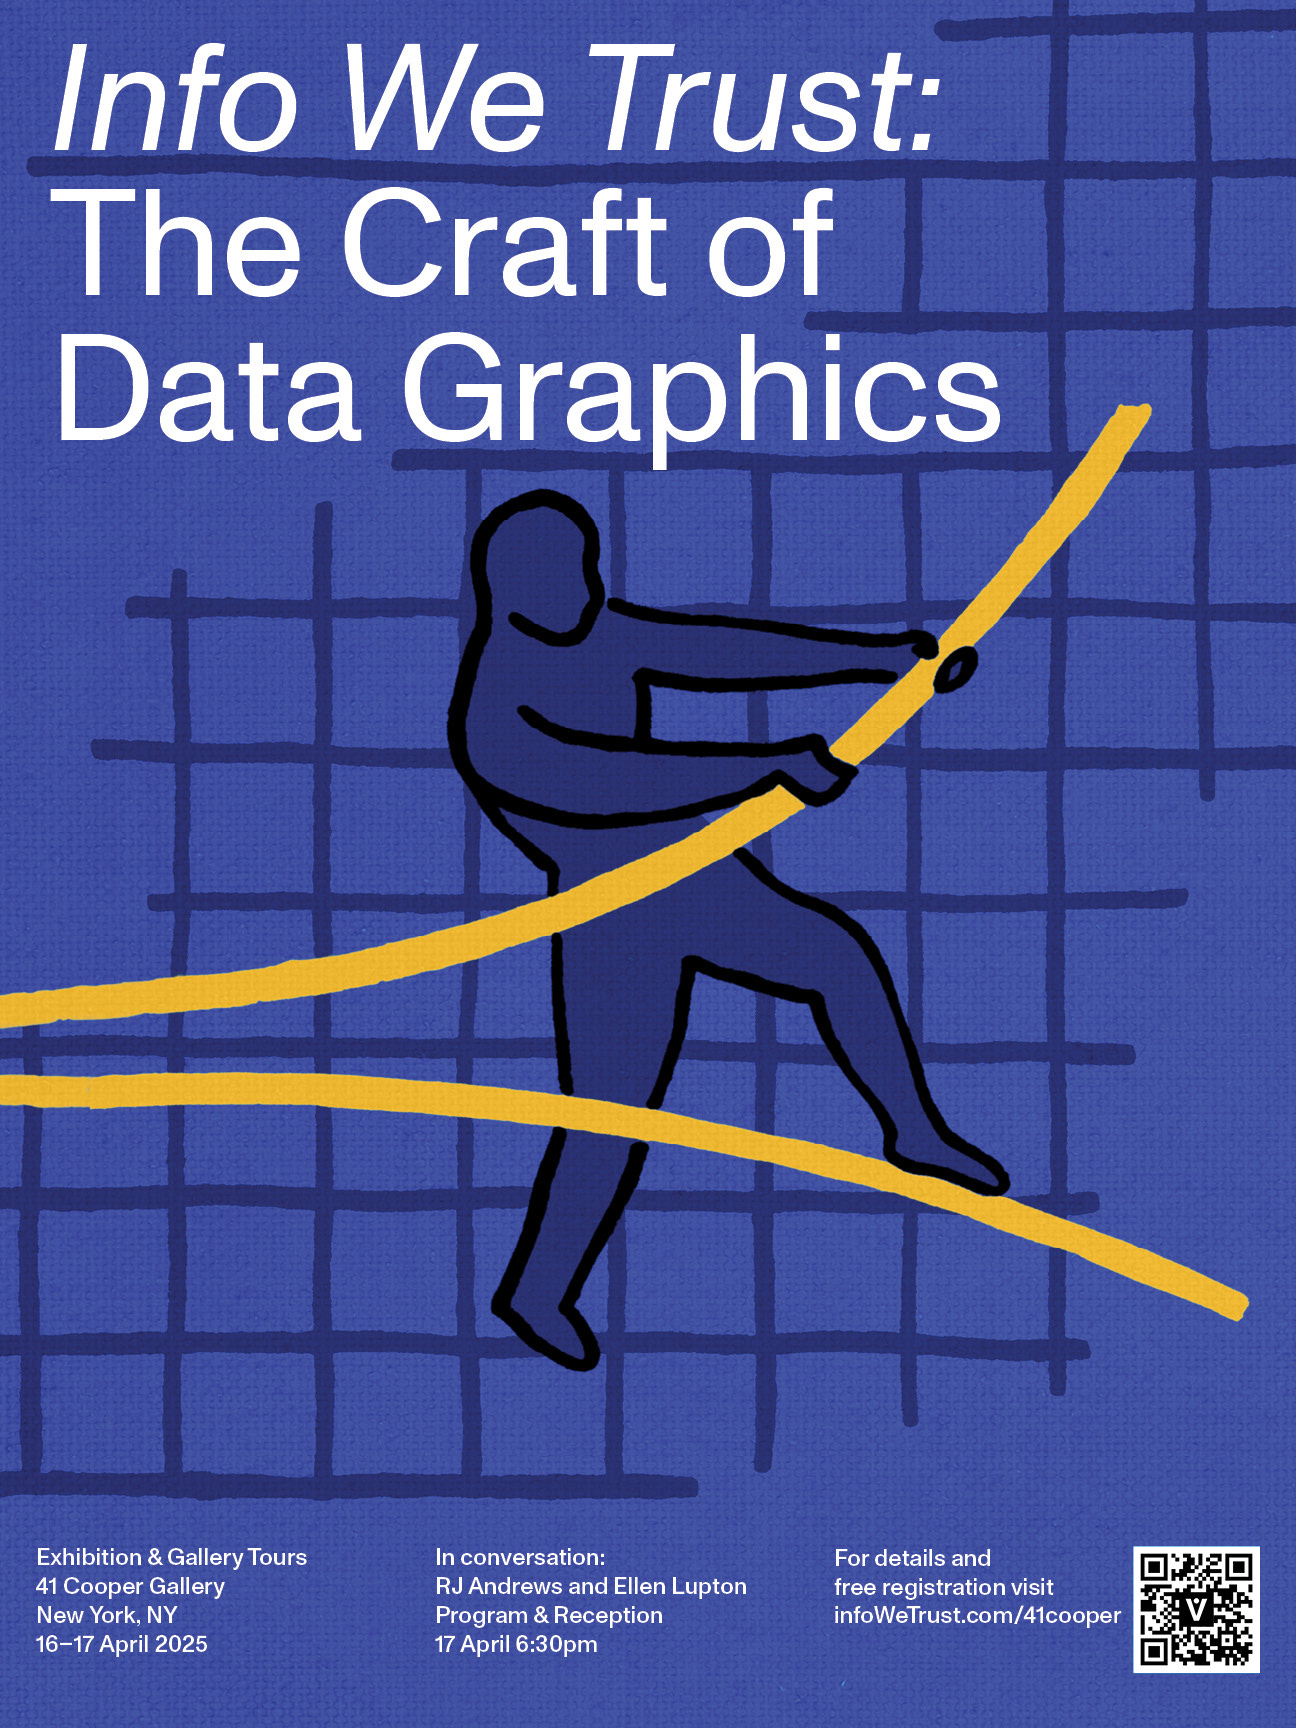
My gallery exhibition at Cooper Union opens April 16. It features original artwork from Info We Trust alongside data graphics by contemporaries—each paired with a rare historic work.
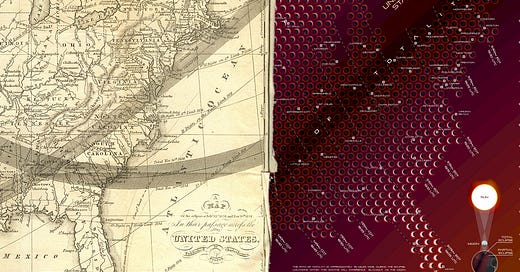
For example, Ken Field's 2024 eclipse map is hung above the first American eclipse map:
“The Baby Spike” by Zan Armstrong, Nadieh Brehmer, and Jen Christiansen is paired with Luke Howard’s 1833 Temperature of London:
W.A. Dwiggins’ funny 1919 frontispiece is paired with a similar downward line graph from Kaamran Hafeez’s New Yorker cartoon: “I don’t get it, We had all those meetings.”
Many of the show’s featured works are sculptural. Some are making their debut in this exhibition.
In every case, the actual historic artifact will be shown. I’ve made several rare-book acquisitions to make this show real, including a spectacular 1926 Yoshida map that arrived just yesterday from Japan.
Here’s the exhibition poster. You can learn more at infowetrust.com/41cooper
⚠️ Note: The April 17th event and reception with Ellen Lupton is currently over-subscribed. Let me know if you can absolutely be there and I will help get you off the waitlist.
See you in New York!
Onward!—RJ
About
RJ Andrews helps organizations solve high-stakes problems by using visual metaphors and information graphics: charts, diagrams, and maps. His passion is studying the history of information graphics to discover design insights. See more at infoWeTrust.com.
RJ’s next book, Info We Trust, is currently available to order. He published Information Graphic Visionaries, a book series celebrating three spectacular data visualization creators in 2022 with new writing, complete visual catalogs, and discoveries never seen by the public.

