Top Five
Chartography looks back on a year of information graphics
Welcome to Chartography.net — insights and delights from the world of data storytelling.
It’s been a crackerjack year for Chartography. Without any evident algorithmic boost we hit 4,000 subscribers, growing the old-fashioned way: smooth and steady.
We’ve also danced across a lot of essays about information graphics. Here are fancy links to five articles from 2024 you loved lots. Each is paired with a new note about why they are worth re-viewing.
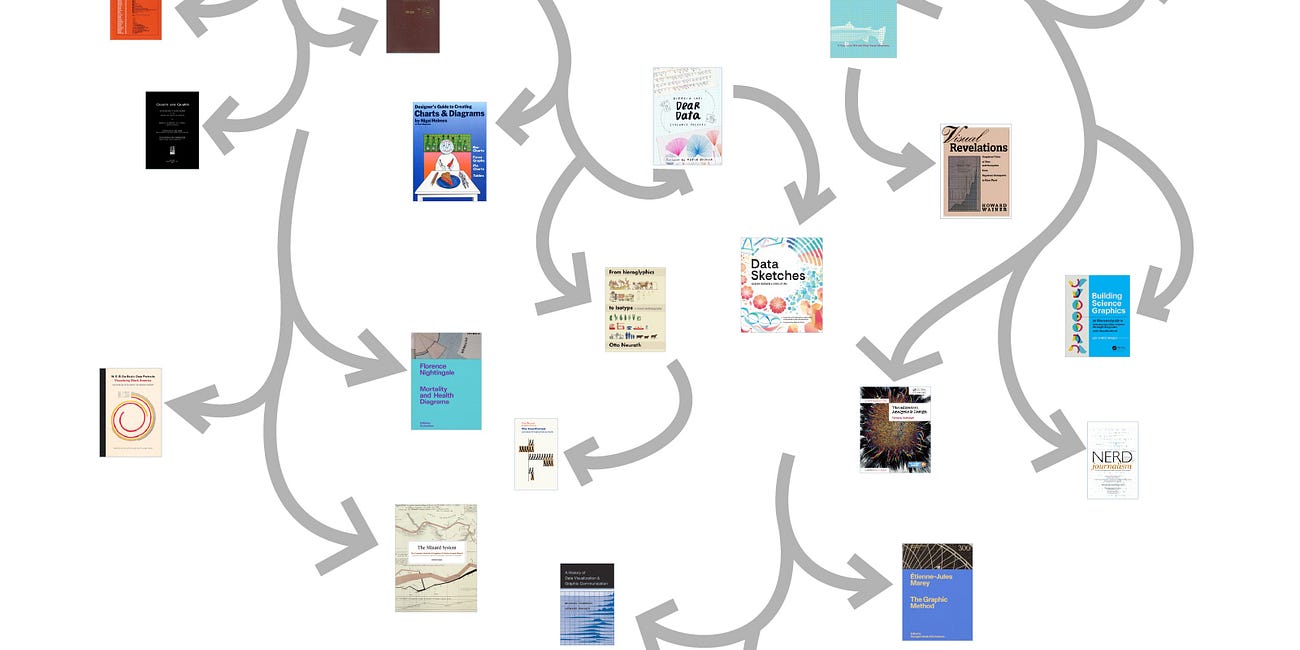
How to Start a Data-Graphics Library
One of the favorite requests I get is to help someone choose a data-graphics book. What follows are some suggestions for how to start building your own library: What to read first, and then what to read next.
I believe in print information graphics and I want you to believe in them too. This book recommender is the article I’ve shared most with friends new and old since its publication. Have you bought a data-graphic book today?
This Chart Kills Fascists
The Nuremberg trials, held by the Allies against the remnants of Nazi Germany, were pivotal in establishing legal precedents for prosecuting war crimes and atrocities. The Wikipedia article on the trials includes "Besides legal professionals, there were many social-science researchers, psychologists, translators, and interpreters, and graphic designers, the last to make the many charts used during the trial." The mention of graphic designers creating charts for these trials was irresistible catnip for me. I had to see these charts.
Nazis are Hollywood’s favorite bad guys. I was delighted to learn that information graphics helped convict some of the worst at the Nuremberg Trials. It doesn’t make the charts good, of course. Charts are just tools; some of those presented at Nuremberg were self-incriminating Nazi graphics.
Delicious Parks
What if each U.S. National Park had a cookie-cutter section removed and placed on a giant chessboard for easy comparison?
About once a year I’m able to achieve some sort of new vision, pushing myself and maybe even the field a little. If you do this for a decade then you will have a nifty little portfolio. My latest vision was only achievable because I had the most excellent partner in Wendy Shijia Wang. She helped me accomplish and learn much more than I ever could on my own.
Seeing Centuries, Part 2
Could human recorded history and the deep history of human migration be visualized together? Yes, and I’m excited to show you how.
Developing new simple—even crude—ways of seeing things is when I feel most alive doing this craft. It’s not glamorous portfolio fodder, but it has powerful energy. (And if you are new to Chartography, don’t miss Part 1.)
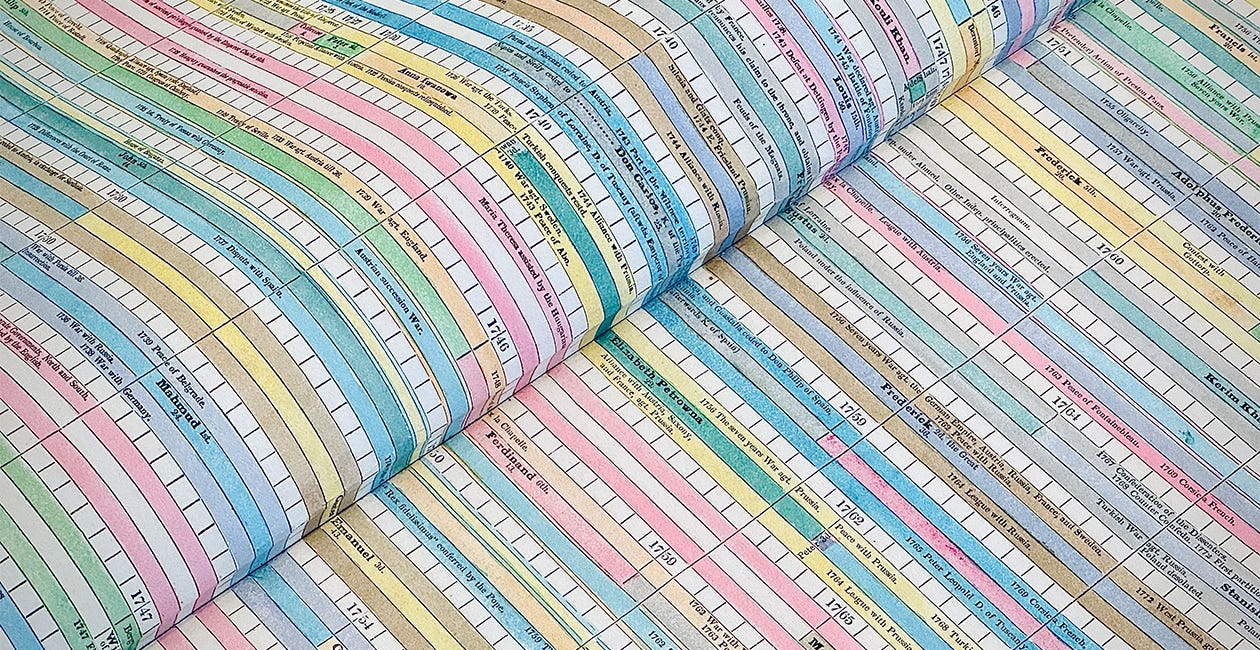
Colossal Chronography
An "Embellished Chart of General History and Chronology" is an extraordinary piece of information design from 1831 London. In the history of colorful timelines, this one stands out in several ways: It is immense. It is relatively early. It seems unknown to modern researchers. It was created by a woman.
Finding Lightfoot’s monumental timeline—a ginormous colorful masterpiece created before there were any rules—blew me away. I wanted to shout it from the top of a mountain, but I didn’t have a mountain, I had a newsletter. This discovery encourages me to keep hunting for spectacular unknown information graphics.
One final thanks to Chartography, and thanks to you: In the wake of Twitter’s deflation, this newsletter was critical in mustering an outstanding campaign for my new book Info We Trust Remastered. All books are finally in their proper European and United States warehouses. I plan to execute all Kickstarter and pre-orders in early January. Slow is smooth and smooth is fast.
Chartography will return in 2025.
Onward!—RJ
Note: The social card image for this edition is “The Seeker” by IREFAELS.
About
RJ Andrews helps organizations solve high-stakes problems by using visual metaphors and information graphics: charts, diagrams, and maps. His passion is studying the history of information graphics to discover design insights. See more at infoWeTrust.com.
RJ’s next book, Info We Trust, is currently available for pre-order. He published Information Graphic Visionaries, a book series celebrating three spectacular data visualization creators in 2022 with new writing, complete visual catalogs, and discoveries never seen by the public.


