Welcome to Chartography.net — insights and delights from the world of data storytelling.
TODAY (after a new video and some other updates): my most curious and constructive response to last week’s U.S. election.
Virtual office hours have been a hit. (Thank you James for the suggestion!) I’m going to keep them going for a few more weeks. Sign-up to chat data graphics with me:
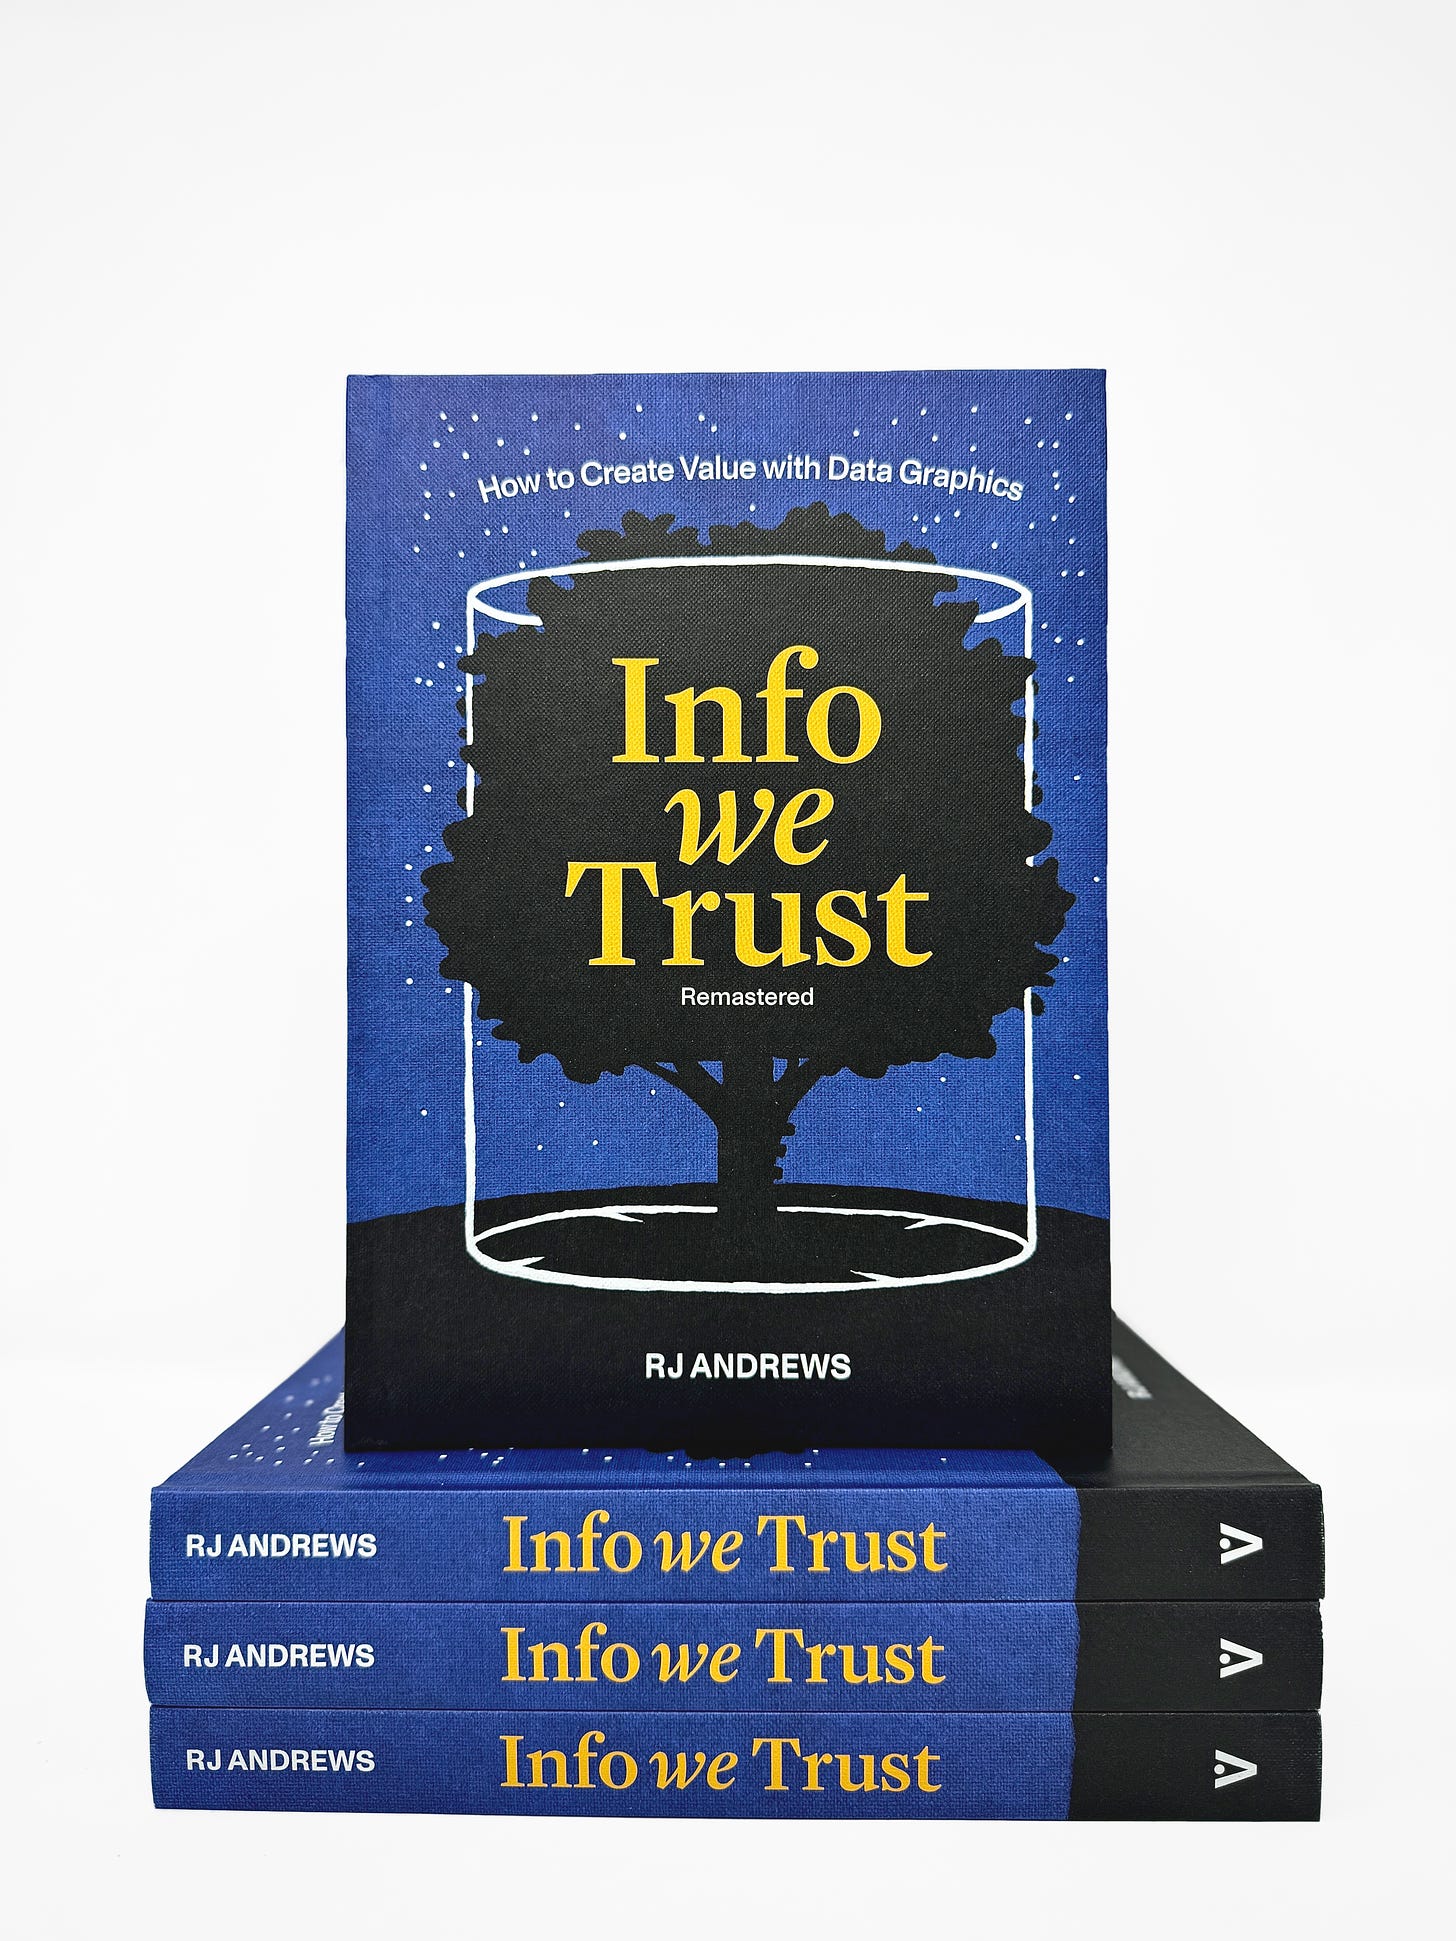
First photoshoot of the real Info We Trust.
“Early Edition” copies are still on sale. To get an early book before its March 2025 launch you should order soon.
They will ship (with the rest of the Kickstarter awards) in early December.
My Letterform Archive lecture is now online:
The first half is a variant of the Compared to what? talk I’ve developed across the past year. The second half is a brand new tour through some wonderful and wacky type design in data graphics.
MAPS FOR KIDS first three designs are on there way. They are: STEAM LOCOMOTIVE, GEOGRAPHY TERMS, and FOOD NUTRIENTS. I want to get six finished by end of November. Can I do it? Let’s find out! Paying subscribers will get an early look at my process soon.
One U.S. election thought
Last week, America returned Donald Trump to the White House. A couple days later, I plucked out one unifying, and perhaps constructive, idea from a frothy sea.
Everyone’s reality detector is broken.
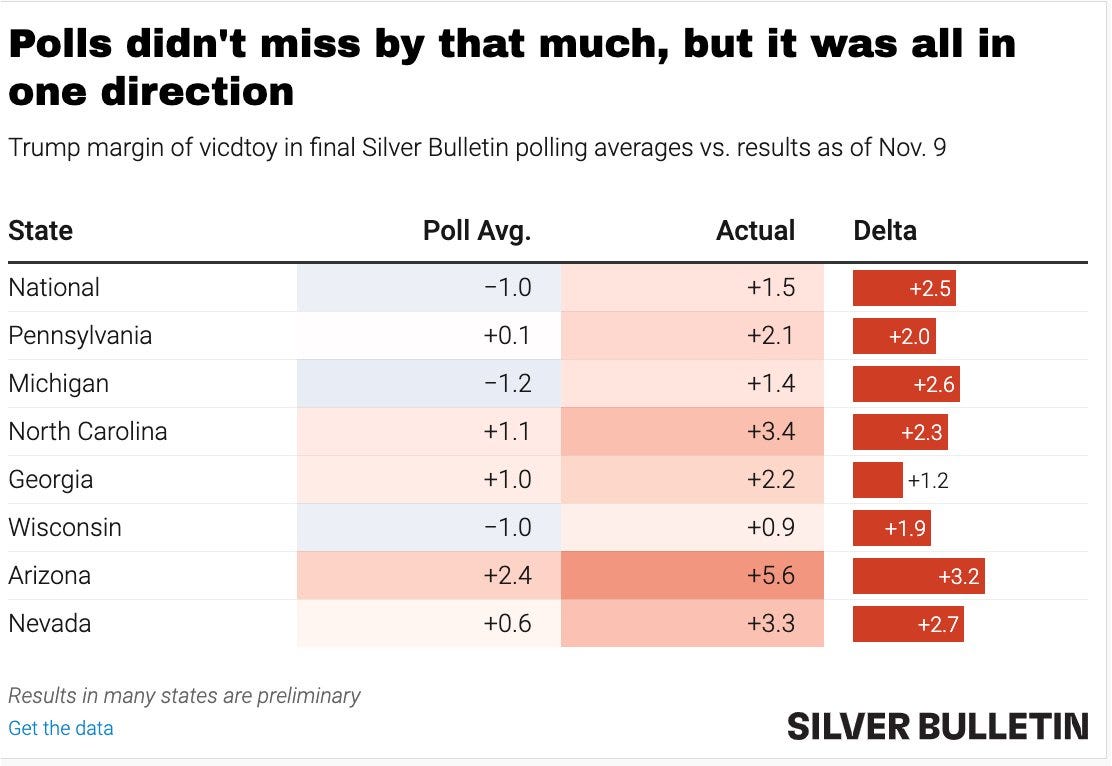
Yes, everyone’s reality detector is broken. For example, many Harris-voters were shocked by the margin of Trump’s victory. One might approximate this surprise by looking at how polling missed the mark in swing states—not by a large amount, but by a critical amount. [Chart from Nate Silver’s
]If you assumed a Harris victory, then a constructive response to the election outcome might be humble curiosity. Perhaps curiosity about your own biases and blindspots. And also curiosity about the other side, how they thought about the candidates, how they think about the country.
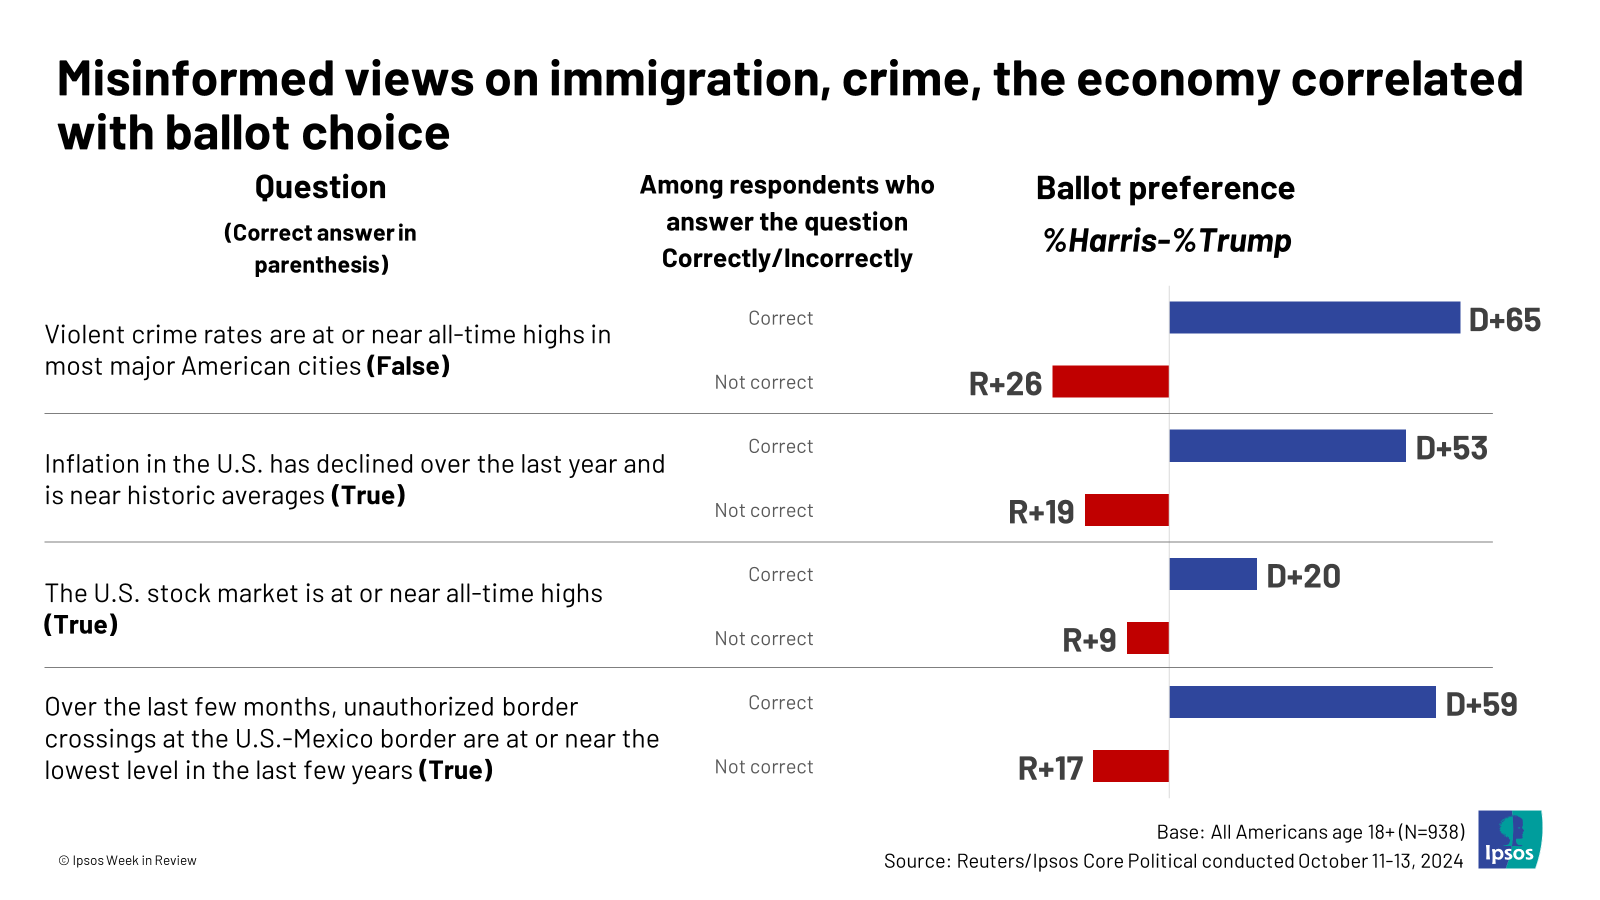
Unfortunately, this curiosity runs me into a brick wall. Because, everyone’s reality detector is broken. For example, Ipsos recently showed how Trump-backers have misinformed views on immigration, crime, and the economy.
My empathy for their pickled perspectives isn’t sympathy. It’s pity.
Beyond any candidate, we sink into our information ecosystem and its many thorns. Trump has a modern and brutally effective machine behind him. And there’s no substantial media counter from Democrats. At the risk of equivocating, legacy media didn’t do Biden & Co. many favors. From normalizing Trump’s behavior to months and months of telling us about a Biden recession that never came.
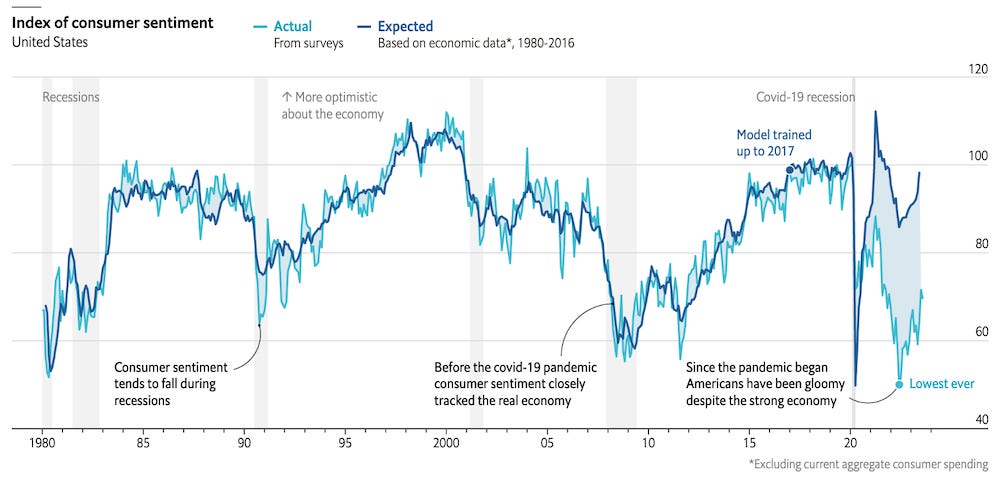
Disconnected-from-reality bad-vibes theories of everything helped resurface this 2023 Economist chart, which revealed a recent and startling detachment between consumer sentiment and economic indicators.
Everyone’s reality detector is broken. Mine too. (I’m trying to map all of the election hot takes in one place, just to attempt a handle on what’s going on. See the map on Bluesky.)
From my blurry perspective, our problems go far beyond any candidate’s strengths or weaknesses. This needed attention to bigger issues is neatly expressed:
I don’t know what Harris could have done differently to win the election and I don’t know what Trump could have done differently to lose it.—Ned Resnikoff on Bluesky
Every data graphic is a microcosm, a mini world, a thin slice of reality. But a truthful representation of reality does not guarantee truthful action. Recall all those 1970s ExxonMobil projections that accurately forecasted global warming.
The moment reminds me of the main lessons from spending so much time with Florence Nightingale. Having a beautiful chart is nice, maybe necessary. But it’s just table stakes. The hard part is getting trustworthy information in front of people, often the right people, over and over and over. It can take decades, or longer. Ask abolitionists, suffragettes, and civil rights activists about the stamina needed to achieve real progress.
I invested my first dozen years after grad school into information graphics. Here’s why: Positively, information graphics are pretty neat. Neutrally, I thought the rise of digital worlds was a little wave I might catch. Critically, I was frustrated with how information was packaged and traveling around the Internet.
Today, information graphics are neater than ever. But that neutral digital wave has soaked us in all sorts of ugly problems to contend with. Sometimes, I feel like a proverbial shoe salesman who arrives to a new land to learn that its people do not wear shoes. This could be horrible—there is zero market for your product. Or it could be wonderful—there is an enormous market for your offering.
Going forward, I do not know yet understand what I am going to do differently. But I do know that I am going to keep working at my craft, and my distribution a la Nightingale, to do what I can to foster better shared understanding.
The moment also reminds me of the bridge from “As” by Stevie Wonder:
We all know sometimes life's hates and troubles
Can make you wish you were born in another time and space
But you can bet your life times that and twice its double
That God knew exactly where he wanted you to be placed
So make sure when you say you're in it, but not of it
You're not helping to make this earth a place sometimes called Hell
Change your words into truth and then change that truth into love
And maybe our children's grandchildren
And their great-grandchildren will tell
I'll be loving you
All of our detectors are broken. None of us perfectly know reality. How could we? We need each other because individually, we know very little.
If we are all barefoot, then I want to make shoes.
Onward!—RJ
About
RJ Andrews helps organizations solve high-stakes problems by using visual metaphors and information graphics: charts, diagrams, and maps. His passion is studying the history of information graphics to discover design insights. See more at infoWeTrust.com.
RJ’s next book, Info We Trust, is currently available for pre-order. He published Information Graphic Visionaries, a book series celebrating three spectacular data visualization creators in 2022 with new writing, complete visual catalogs, and discoveries never seen by the public.



+here's the latest, and maybe last, update to my tally of election hot-takes: https://bsky.app/profile/infowetrust.com/post/3latzjhj7b22p